
Full title:
Play mapping workflow – a practical example from the onshore Otway Basin, South Australia
Paul Strong and Chris Cubitt
Geological Survey of South Australia, Department for Energy and Mining
Download this article (PDF 6.5 MB)
Published November 2024
Introduction
The Otway Basin is one of the Mesozoic rift basins that span the southern coastline of Australia formed as a result of rifting between the Antarctic and Australian plates. The basin is a proven hydrocarbon province with discoveries and production both onshore and offshore. The onshore portion of the basin covers nearly 10,000 km2 in South Australia (Fig. 1) and has produced nearly half a million barrels of oil and 86 billion cubic feet of gas (PEPS South Australia).
In 2023 the Geoscience and Exploration Branch (now part of the Geological Survey of South Australia, or GSSA) of the Department for Energy and Mining (DEM) conducted an integrated geological, chemostratigraphic, geochemical and geophysical study to prepare a petroleum systems model of most of the onshore Otway Basin in South Australia (SA). The model showed significant hydrocarbon generation in the Penola Trough as expected, but also for the first time it indicated that significant oil and gas may have been generated and expelled in the lightly explored Robe and Tantanoola Troughs (Edwards et al. 2024).
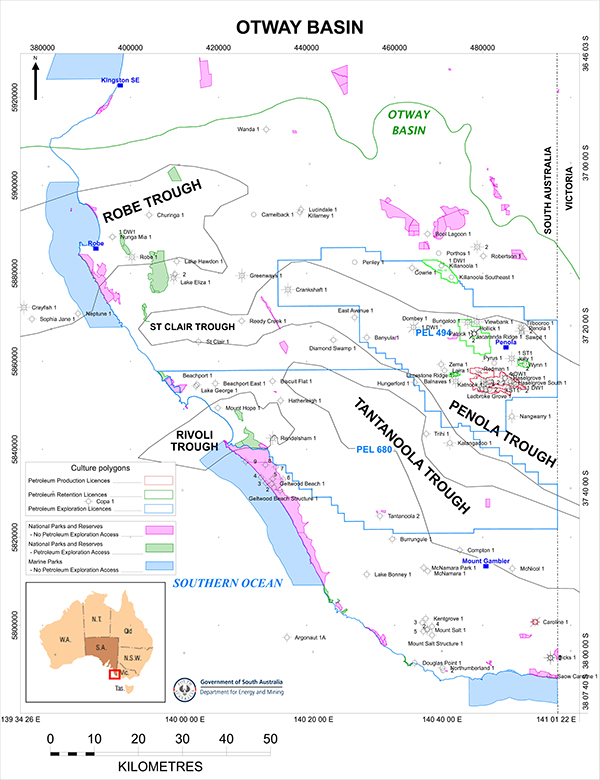
Figure 1 Location map of the onshore Otway Basin in South Australia, with petroleum licences, wells, national parks and reserves, and subsurface structural troughs. (PDF 284 KB)
Play analysis
Petroleum play analysis of key intervals in the SA onshore Otway Basin was an important part of highlighting the prospectivity in this region.
What is a petroleum play? A ‘play’ is defined by Rose (2017) as a trend or family of geologically related leads, prospects, and possibly producing oil and gas fields, with primary elements of similar geological history of hydrocarbon charge, reservoir/seal pairs and trap controls on their occurrence. They are typically defined by stratigraphic age, with plays generally separated by a regionally significant master seal.
A petroleum system links an active or once active source rock to all the geological elements and processes that are essential for a hydrocarbon accumulation to exist in time and space, such as carrier beds, reservoir rocks, seals and overburden, trap formation, migration, accumulation and preservation (Magoon and Beaumont 1994). The moment petroleum is generated, biologically or thermally, a petroleum system is formed, thus the presence of petroleum is proof that a system exists. A petroleum system can ‘source’ more than one play.
Play analysis, or play-based exploration (PBE), is simply a technique to build and leverage an understanding of geological basins and petroleum systems, following a methodology that incorporates the integration of many tools such as seismic data, well log and palynological data, structural analysis and geochemistry to define a series of play maps that can be used to focus exploration strategy and improve prospect chance assessment (Strong, 2024). In theory there is no chance of the play being found outside of the approximate extent of any given play, but as with all models the limits are only as good as the data used to construct them. Therefore, this process is not static, requiring iterative feedback following new information from drilling, seismic data, studies etc to update the knowledge base and keep it as up-to-date as possible.
Elements of the PBE methodology are represented by the PBE Pyramid shown in Figure 2a (Strong, 2024, modified from Royal Dutch Shell 2014), based on different levels of information and understanding, with increasing detail and focus moving up the pyramid, from the tectonic plate setting, through basin and play focus, through to prospect focus, including Scope for Recovery (SFR) volumes.
The play focus relates to how an understanding of the sedimentary fill of a basin leads to the identification, mapping and quantification of a play or plays within it. Various data (wells, cores, seismic, etc) are integrated with peer reviewed gross depositional environment (GDE) maps made for each interval. These layer-specific GDE maps show the location of the various play elements (reservoir, seal, etc) and are used to determine the inter-relationships of play elements with respect to individual layers. It is then possible to create play maps from which common risk segment (CRS) maps can be directly defined. The CRS maps, in turn, illustrate hydrocarbon sweet spots enabling critical exploration decision making. Examples of play elements in the context of a play map are shown in Figure 2b.
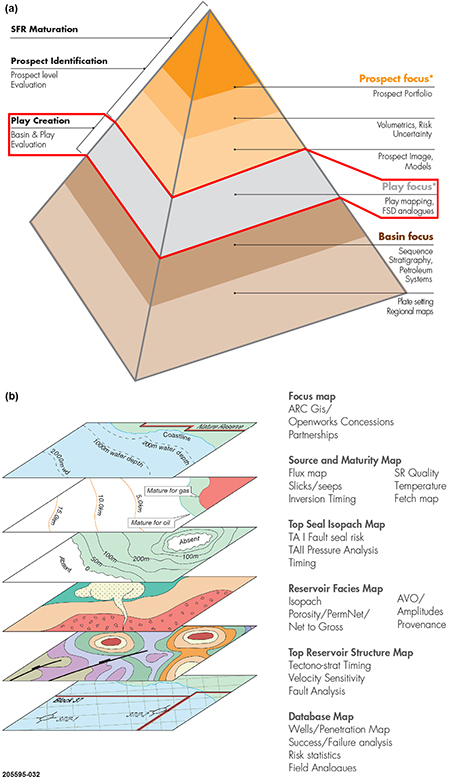
Figure 2 (a) The ‘Exploration Pyramid’ with play-based exploration segment highlighted in red. (b) Input data example for play-based exploration (Strong 2024, modified from Royal Dutch Shell 2014). (PDF 716 KB)
Play analysis has recently been conducted by the GSSA Basin Prospectivity team with the intention of stimulating exploration for additional hydrocarbons in the onshore Otway Basin. Eight intervals were reviewed for reservoir distribution, presence of a sealing interval above, and likely charge from potential source rocks that may have generated hydrocarbons. Figure 3 shows the seven depositional plays reviewed, plus the fractured Basement, with all the results documented on the DEM website.
It should be noted that CRS maps were not compiled as part of this work, and the geological risk of individual traps were not estimated.
It should also be noted that the reservoir and seal maps created as part of this study could also be used to identify gas storage opportunities, such as for methane or hydrogen, or carbon capture and storage (CCS).
Play analysis of the Pretty Hill Sandstone
The main reservoir in the SA onshore Otway Basin is the Pretty Hill Sandstone (Fig. 3), which has produced 429,232 barrels of oil and 82.51BCF of gas (PEPS South Australia).
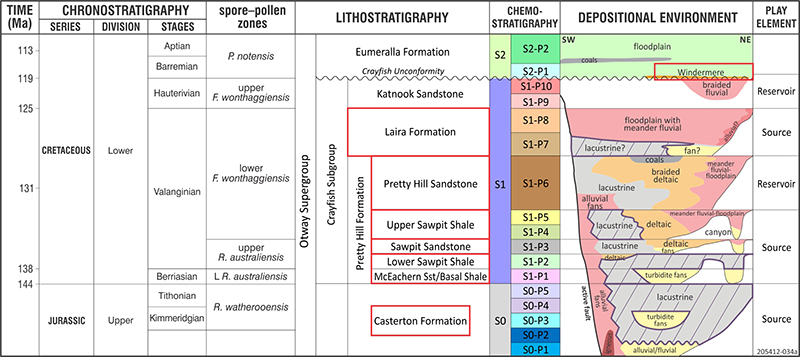
Figure 3 Onshore Otway Basin stratigraphy and plays reviewed in the study (modified from Kirk 2024). Plays reviewed are highlighted in red, and source rocks are highlighted in purple. (PDF 448 KB)
Play analysis of the Pretty Hill Sandstone is discussed here as an example of the methodology used.
1. Gross depositional environment mapping
Gross depositional environment (GDE) mapping is one method that enables an understanding of the distribution of a potential reservoir section, integrating many different types of data such as core analysis and seismic interpretation. Mapping conducted in 2023 interpreted varied depositional systems including anoxic, extensive ice-influenced lacustrine, lacustrine turbidite (Tiainen et al. 2024), extensive fluvial/lacustrine, fluvial/flood plain and growth fault-bound ribbon-like alluvial fan aprons (Cubitt et al. 2024).
The sandstones of the Pretty Hill Sandstone are typically well-sorted fine to medium grained, with interpretation of core indicating deposition in an anastomosing fluvial system. Figure 4 shows the data and working interpretations of the first pass GDE map for the Pretty Hill Sandstone, sketched on top of the isopach – or thickness – of the interval. This map shows a clear division between a channel fairway trending parallel and close to the main fault system (blue and purple in the south-east of Fig. 4) with flood plains to the north in yellow. The resulting GDE map is illustrated in Figure 5.
As discussed above, iteration of interpretation is required in play analysis. The process of play mapping required the review of all GDE maps and thus initiated an iteration, further highlighting layer-by-layer prospectivity. This circumstance occurred in the Pretty Hill Sandstone interval with further data integration in the northwest of the basin revealing the potential presence of a meandering channel system in the Robe Trough, resulting in the final GDE map shown in Figure 6.
The best reservoir quality in the Pretty Hill Sandstone likely occurs within the anastomosing and braided river systems, with the alluvial fans expected to provide reasonable quality reservoirs as well. Therefore, the yellow and orange polygons shown on Figure 6 should be targeted for the best reservoirs in this interval, although the floodplain areas shown in grey in Figure 6 may contain smaller river systems with potential reservoir sandstones.
It must be remembered that the outlines shown are interpretive and are only as good as the information used to construct them; the seismic coverage is relatively sparse in some parts of the Otway Basin and the wells are also relatively widely spaced, so there will be some variability on the exact locations of the limits shown.
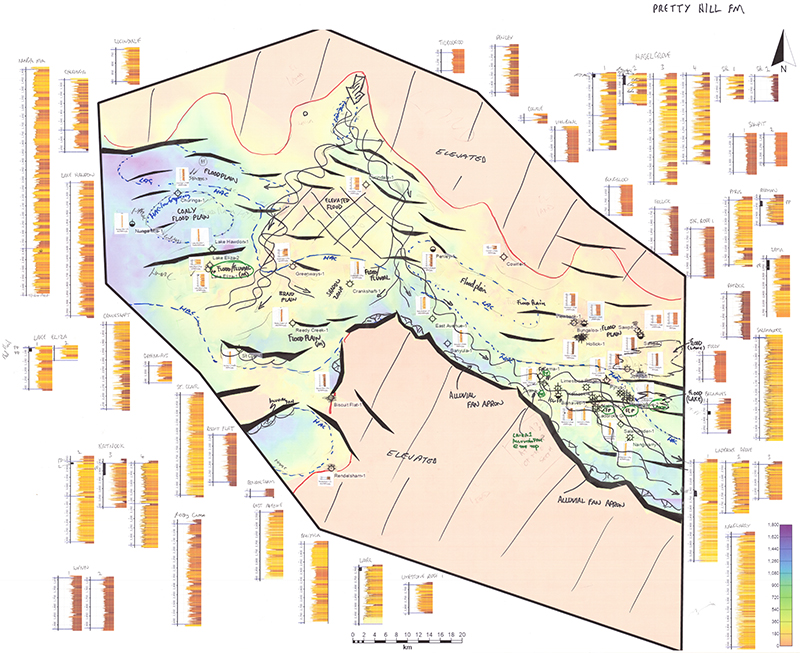
Figure 4 Data and working interpretation of the gross depositional environments map of the Pretty Hill Sandstone, sketched on top of the coloured isopach for the interval; yellow indicates the thinnest and purple the thickest section, with orange where the interval is absent. Gamma ray log signatures from wells surround the map, with yellow indicating the presence of sandstone and brown the presence of siltstones and muds. (PDF 1.2 MB)
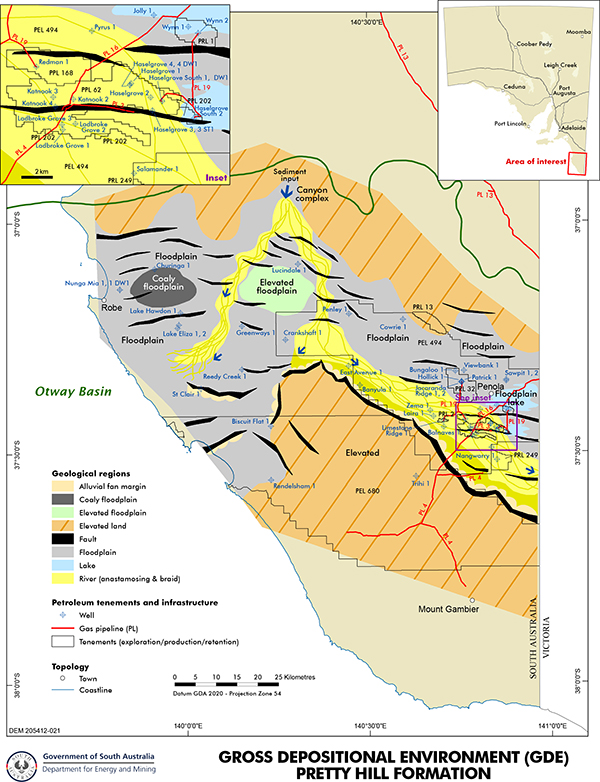
Figure 5 First pass gross depositional environment (GDE) map of the Pretty Hill Sandstone (from Cubitt et al. 2024). (PDF 301 KB)
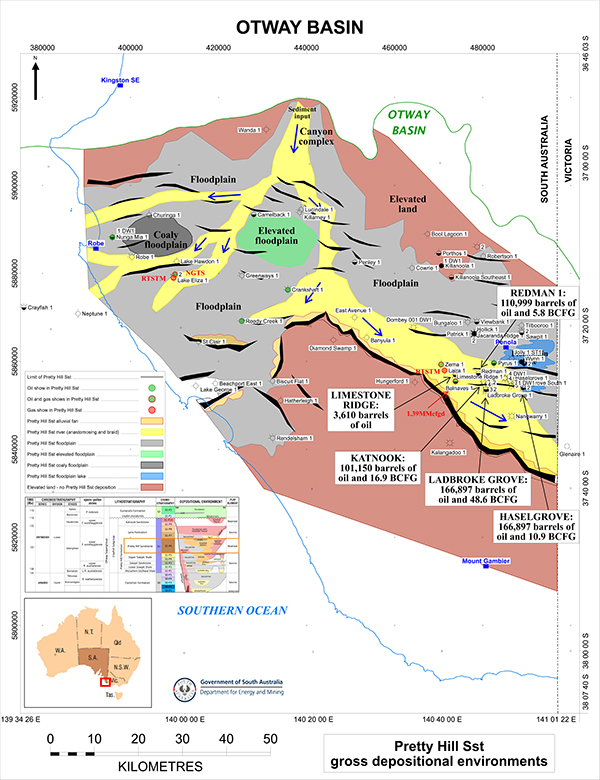
Figure 6 Final gross depositional environments map of the Pretty Hill Sandstone. (PDF 614 KB)
2. Seals for the Pretty Hill Sandstone
A seal for a petroleum reservoir can be defined as rock strata with sufficiently low porosity and permeability to retain reservoired hydrocarbons in a trap by preventing migration through them.
Two formations provide the seal to the Pretty Hill Sandstone, as shown in Figure 7:
- Shales and siltstones of the Laira Formation over the southern portion of the area.
- In the north where the Laira is absent seal is provided by shales of the Eumeralla Formation. However, in the north-west the Windermere Sandstone is present at the base of the Eumeralla, so it is likely that there may not be a competent seal for the Pretty Hill Sandstone if the Windermere Sandstone directly overlies the Pretty Hill reservoir. In this instance the Pretty Hill Sandstone would have acted as a migration path for hydrocarbons into Windermere Sandstone traps, sealed by shales of the Eumeralla Formation.
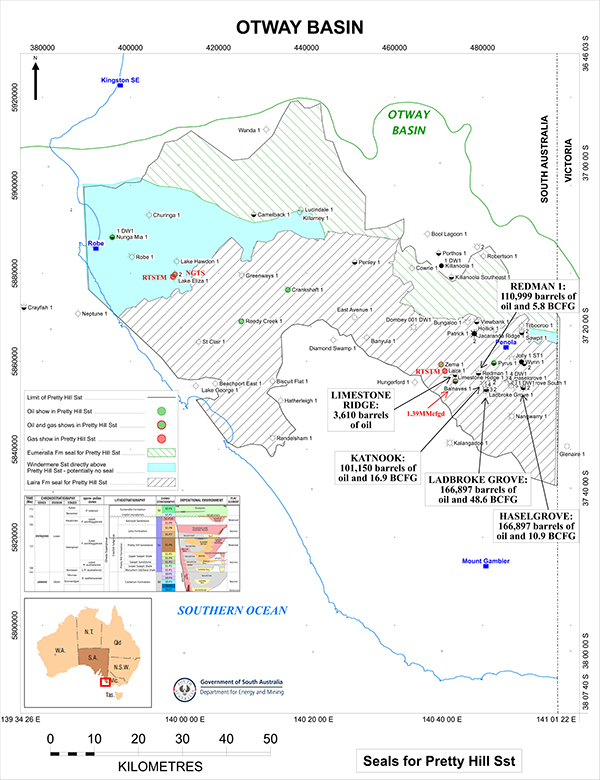
Figure 7 Seals for the Pretty Hill Sandstone. (PDF 669 KB)
3. Source rocks for the Pretty Hill Sandstone
A petroleum source rock is an interval which contains sufficient organic matter to be a future source of hydrocarbons. Sufficient lateral extent and thickness (i.e. volume of source rock), organic content, and thermal maturity at depth are required to generate hydrocarbons.
Several source rock intervals have been previously identified in the Otway Basin (Fig. 3). A revision of the existing geochemistry database, seismic stratigraphy and source rock model development in this study indicates potential good quality, liquids-prone lacustrine source rocks are present in the Jurassic Casterton Formation, and the Early Cretaceous Lower Sawpit Shale. Gas-prone source rocks are likely to be present in the Upper Sawpit Shale and Laira Formation (Fig. 3).
Modelling suggests most liquid hydrocarbons were generated and expelled from the Lower Sawpit Shale between 126 and 70 Ma, with the greatest volume sourced from the Penola and Robe Troughs. Gas and condensate expulsion also took place from the Upper and Lower Sawpit Shale in the Penola and Robe Troughs, with expulsion complete by around 30 Ma. Gas is modelled to have been generated and expelled from the Laira Formation in the Tantanoola Trough (100 Ma – present day). The results of the petroleum systems model of most of the onshore Otway Basin in South Australia is documented in Edwards et al (2024) and on the DEM website.
For the Pretty Hill Sandstone underlying source rocks may have provided sufficient generation of gas and/or oil for migration to have occurred into the reservoir, i.e. the Upper and Lower Sawpit Shale and the Casterton Formation. Areas where hydrocarbons have possibly been expelled from these source rocks are shown in Figure 8.
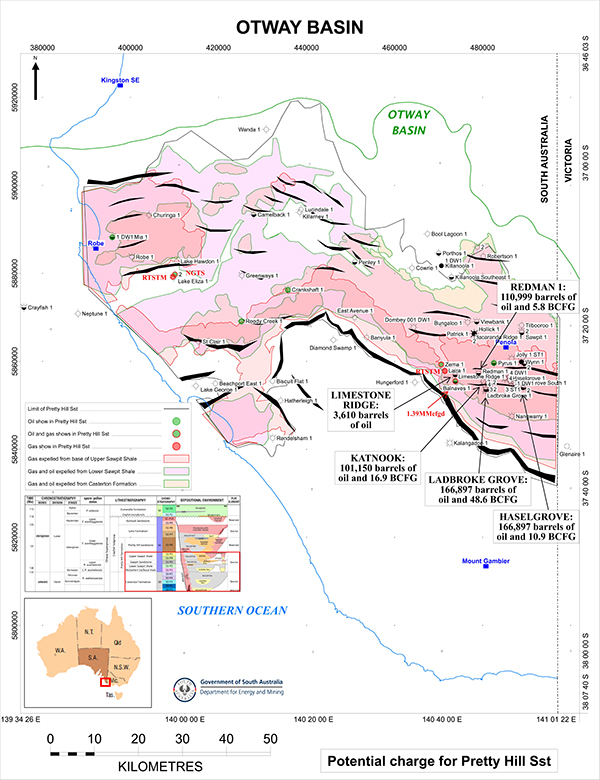
Figure 8 Potential charge for the Pretty Hill Sandstone. (PDF 736 KB)
4. Play elements for the Pretty Hill Sandstone
Once the distribution of each of the individual elements of the play analysis have been determined they are plotted together on one map. For example, the top-down outlines of the sealing intervals for the Pretty Hill Sandstone, the potential reservoir sections, and areas where gas and oil may have been expelled from underlying source rocks are shown in Figure 9.
Maps showing all the play elements may display a lot of information, as is the case in Figure 9. In this case it may be time-consuming to review all the information but is necessary in order to identify areas of hydrocarbon prospectivity.
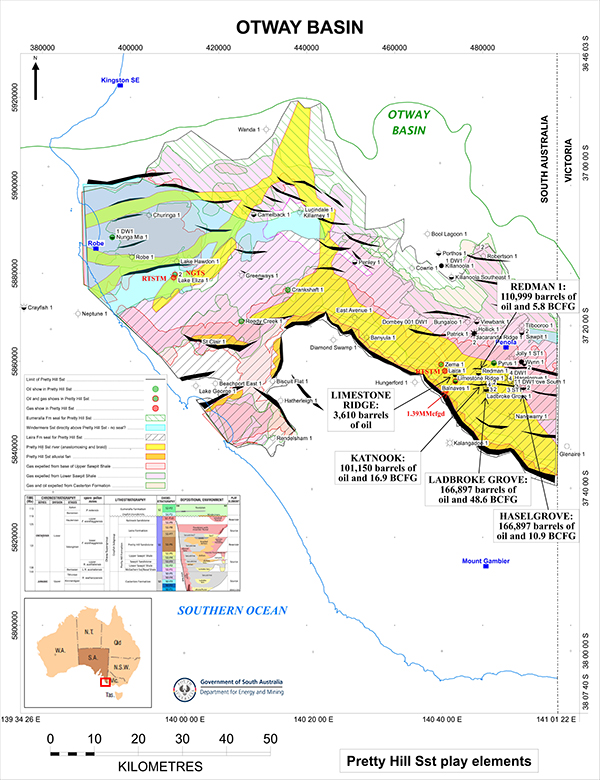
Figure 9 Pretty Hill Sandstone play elements. (PDF 817 KB)
5. Pretty Hill Sandstone play map
The final step in the play analysis is to review where the suitable elements overlap each other to provide potential sweet spots for hydrocarbon accumulations, in other words locations where a good reservoir may be overlain by an ideal sealing interval and underlain by a mature source rock that has expelled oil and/or gas.
In the Pretty Hill Sandstone example, the best places hydrocarbon accumulations are likely to exist are those shown in green in the play map in Figure 10; all the production from the Pretty Hill Sandstone has occurred in the Penola Trough within the light green area representative of the sealed river system above the mature Upper Sawpit Shale source rock. The other areas in colour do not necessarily mean they would not be prospective, but may require some further investigation, such as a identifying a migration path from a suitable source rock or a good seal between the Pretty Hill Sandstone reservoir and the Windermere Sandstone above. In addition, the floodplain areas that make up the uncoloured area within the Pretty Hill Sandstone extent may contain unidentified smaller river systems with potential reservoir sandstones that could be sealed and charged with hydrocarbons.
As discussed earlier the play maps generated as part of this process are only as good as the data used to construct them, so there may be some variability on the exact locations of the limits shown in Figure 10. And further investigation of the data may result in revisions to some of the outlines, and of course further seismic acquisition and drilling will help to revise the interpretations.
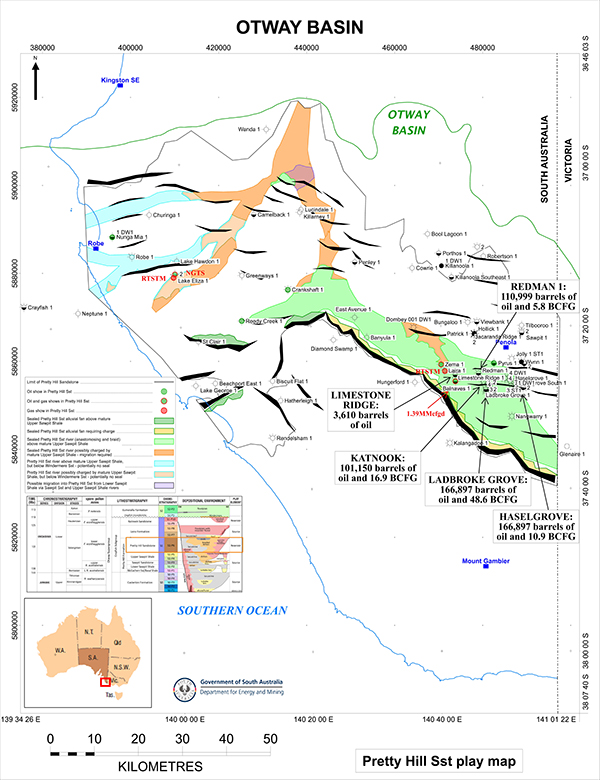
Figure 10 Pretty Hill Sandstone play map. (PDF 613 KB)
Conclusion
One method of stimulating exploration for hydrocarbons in a region is to conduct play analysis to understand the distribution of reservoirs, seals, mature source rocks and hydrocarbon migration pathways. Play analysis, or play-based exploration, is simply a technique to build and leverage an understanding of geological basins and petroleum systems, following a methodology that incorporates the integration of many tools. Fundamentally, this process is not static, with iterative feedback required following new information from drilling, seismic data, studies etc to update the knowledge base and keep it evergreen.
The GSSA has recently conducted play analysis in the onshore SA Otway Basin, with eight intervals reviewed for reservoir distribution, presence of a sealing interval above, and likely charge from potential source rocks that may have generated hydrocarbons. The results of this analysis for the main reservoir, the Pretty Hill Sandstone, presented in this paper include identification of ‘sweet spots’ for both petroleum and gas storage exploration.
Data availability
All data is available through the DEM website
Conflicts of interest
No conflicts of interest exist between these authors and any other person or organisation.
Declaration of funding
No funding from external organisations was received for this project.
Acknowledgements
We thank DEM management for supporting this work and Elinor Alexander and Sharon Tiainen for providing constructive reviews. This abstract is published with the permission of DEM and released under the Creative Commons Attribution 4.0 International License.
References
Cubitt C, Kirk R, Rady T and Tiainen S 2024. Gross depositional environment mapping in the onshore South Australian Otway Basin: an example of data integration. Australian Energy Producers Journal 64(S1):S347–S353. https://doi.org/10.1071/EP23083
Edwards C, Rady T, Cubitt C, Kirk R and Tiainen S 2024. Petroleum Systems Analysis of the Onshore Otway Basin, South Australia. Australian Energy Producers Journal 64(S1):S359–S364. https://doi.org/10.1071/EP23090
Kirk R 2024. Seismic stratigraphy of the Jurassic – Early Cretaceous sequences of the onshore Otway Basin, South Australia. Report Book 2024/00018. Department for Energy and Mining, South Australia. https://pid.sarig.sa.gov.au/document/2024d147924
Magoon LB and Beaumont EA 1994. Petroleum Systems. In LB Magoon and WG Dow (eds) 1994. The petroleum system - from source to trap; AAPG Mem. 60, 655pp. https://www.searchanddiscovery.com/pdfz/documents/beaumont02/images/beaumont02.pdf.html
PEPS South Australia: Petroleum Exploration and Production System — South Australia. http://www.peps.sa.gov.au/
Rose PR 2017. Evolution of E & P Risk Analysis (1960-2017); AAPG Search and Discovery Article #42063 (2017). http://www.searchanddiscovery.com/documents/2017/42063rose/ndx_rose.pdf
Royal Dutch Shell 2014. Play Based Exploration, A Guide for AAPG’s Imperial Barrel Award Participation. https://iba.aapg.org/resources/training/play-based-exploration
Strong PC 2024. Play analysis in the Pedirka Basin-Poolowanna-Trough region. In: P Strong, M Blades, A Jarrett and V Crombez (eds) 2024. Central Australian Basins Symposium IV, Petroleum Exploration Society of Australia, Special Publication Volume 2:117–128. https://doi.org/10.36404/UVTH9170
Tiainen S, Kirk R, Cubitt C and Rady T 2024. Revisiting the rocks discovers turbidites and a new exploration play in the Penola Trough, Otway Basin, South Australia. Australian Energy Producers Journal 64(S1):S435–S440. https://doi.org/10.1071/EP23089