
Full title:
Sm-Nd isotopic data for South Australia: dataset and report
Claire E Wade, Alexander J Corrick, George Gouthas, Tom Wise and Rian Dutch
Geological Survey of South Australia, Department for Energy and Mining
Download this article (PDF 6.8 MB)
Download the data package (ZIP)
Published November 2024
Introduction
Depleted mantle model ages based on the Sm-Nd isotopic composition of felsic igneous rocks may be used to estimate the age of continental crust formation at regional scales (Champion 2013). Constructing isotopic maps using model ages may have implications for mineralisation by identifying crustal terranes of difference age (and composition) which may correlate with metallogenic regions (e.g. isotopic maps generated for Western Australia (Champion and Cassidy 2007; Lu et al. 2021)) demonstrate correlations with areas of mineralisation (Cassidy et al. 2005; Huston et al. 2005, 2014; Mole et al. 2015). In IOCG and gold deposits, Archean metasomatised subcontinental lithospheric mantle (SCLM) is identified as a key contributor to deposit formation and metal contribution (Groves et al. 2010; Griffin et al. 2013; Tassara et al. 2017; Skirrow et al. 2018). Therefore, identifying regions with Archean metasomatised SCLM are more likely to be prospective for IOCG deposits for example. This is particularly pertinent in South Australia (SA), which hosts a region prospective for IOCG deposits. Champion (2013) previously generated an Australia-wide map of two-stage depleted mantle model ages (TDM2) calculated from the isotopic composition of ~1631 felsic igneous samples collected across Australia. From this compilation, 193 samples resided within South Australia.
Since 2013, the number of datapoints for felsic rocks in SA has increased from 193 (Champion 2013) to 825 (including S-type granites), providing significantly more detail in these isotopic maps. Although not included in the isotopic maps in Champion (2013), the number of mafic to intermediate igneous rocks has increased from 46 to 461 in South Australia.
Here we outline the results of an updated Sm-Nd data compilation from the Geological Survey of South Australia (GSSA) to 2024 and provide an updated map of TDM2 values and crustal residence time (TCR) across South Australia for both felsic and mafic-to-intermediate igneous rocks. The new model age and crustal residence age maps provide better resolution in the distribution of crustal and mantle domains in South Australia. These are manifest as both newly apparent crustal and mantle components, or as areas of continuous crustal or mantle components. In addition, interesting patterns are emerging between crustal and mantle reservoirs, isotopic gradients and mineral systems, suggesting regional isotopic mapping may be used as an empirical indicator for the presence of mineral systems.
Data compilation and map generation
The number of data points captured since the release of isotopic maps by Champion (2013) have increased significantly. Isotopic data was collected from a combination of peer-reviewed research articles, government report books, research student theses and unpublished datasets provided to, or collected by the GSSA. This includes over 200 newly analysed samples by the GSSA since ~2013.
Where possible, location co-ordinates were collected from their original sources and converted to decimal degrees corresponding to the GDA2020 datum. However, in cases where no co-ordinates were provided, they have been estimated on the basis of location maps or descriptions. Aside from the Sm-Nd isotopic composition, other collated metadata includes the analytical methodology, instrumentation used and values for widely used Nd reference materials. Where available, associated whole-rock geochemistry for all felsic igneous samples and metamorphic rocks inferred to originate from a felsic igneous protolith, as well as (meta)sedimentary and mafic to intermediate igneous rocks, has been captured.
Presently, this compilation contains 1968 data points collected from within South Australia and from locations proximal to the State borders. The isotope maps are generated using felsic and mafic to intermediate igneous rocks from this compilation. Felsic and mafic to intermediate igneous rocks are used for isotope mapping because they provide insight into the crust (middle and lower crust) and mantle (including lithospheric mantle), respectively. As such, prior to mapping the isotopic values of this compilation, the dataset was screened to remove samples not suitable for mapping mantle and crustal compositions. This screening process excluded all sedimentary/metasedimentary lithologies, S-type granites and non-representative samples such as metasomatic rocks, xenoliths, enclaves or mineral analyses, leaving a total of 1471 samples, 1233 of which are from South Australia. In this compilation, felsic igneous rocks are defined as SiO2 > 60 wt% and mafic to intermediate igneous rocks are defined as SiO2 < 60 wt%. The total number of felsic igneous rocks used to create the isotope maps is 925 samples (772 from South Australia). 546 mafic to intermediate igneous samples (461 from South Australia) were used to create their respective isotope maps. Although (meta)sedimentary rocks and S-type granites were not used in these maps, Sm-Nd data for those samples are included in the data table with this compilation.
The compiled data was used to create maps showing two-stage depleted mantle model ages (TDM2; a proxy for the age of the source) and crustal residence times (TCR; the difference between TDM2 and magmatic crystallisation age, representing the length of time the source of the igneous rock has resided in the crust) for felsic igneous rocks (Fig. 1) and mafic to intermediate igneous rocks (Fig. 2) for South Australia.
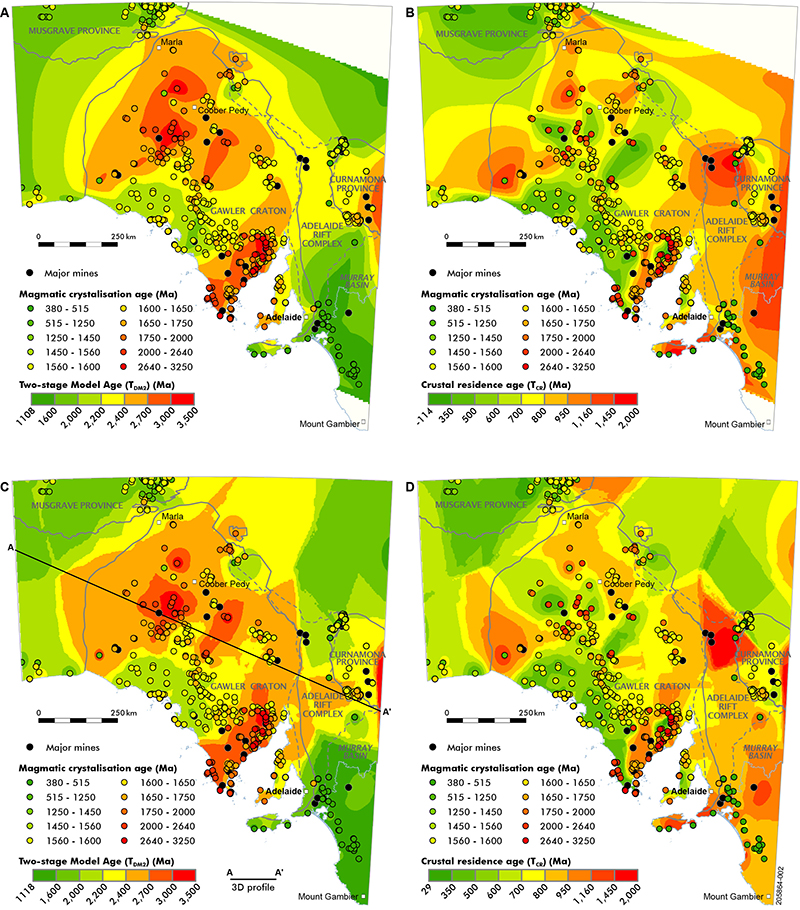
Figure 1 Two-stage depleted mantle model age (TDM2; A and C) and crustal residence time (TCR; B and D) maps for felsic rocks (SiO2 >60 wt%) from South Australia for 935 samples. A) Two-stage depleted mantle model age map using natural neighbour interpolation; B) Crustal residence time map using natural neighbour interpolation; C) Two-stage depleted mantle model age map using inverse distance weighted interpolation; D) Crustal residence time map using inverse distance weighted interpolation. Profile section A-A’ (Figure 4) is shown on C. (PDF 372 KB)
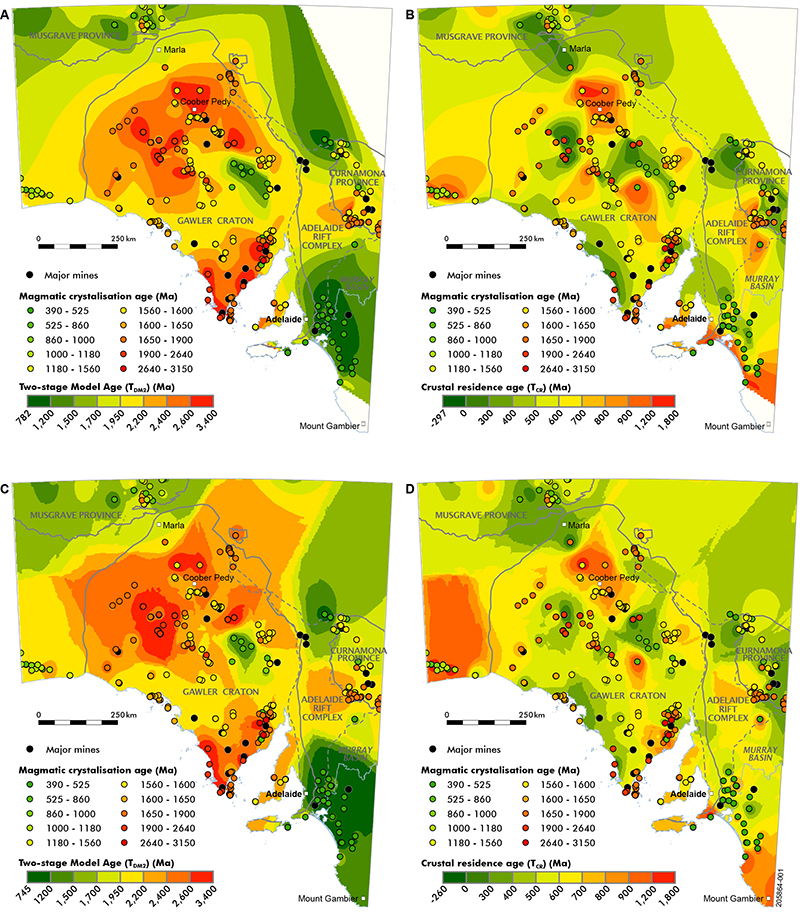
Figure 2 Two-stage depleted mantle model age (TDM2; A and C) and crustal residence time (TCR; B and D) maps for mafic to intermediate rocks (SiO2 <60 wt%) from South Australia for 546 samples. A) Two-stage depleted mantle model age map using natural neighbour interpolation; B) Crustal residence time map using natural neighbour interpolation; C) Two-stage depleted mantle model age map using inverse distance weighted interpolation; D) Crustal residence time map using inverse distance weighted interpolation. (PDF 366 KB)
Maps were produced in ArcGIS Pro using two differing algorithms – Natural Neighbor1 (as used in Champion (2013), and Inverse Distance Weighting2. The Natural Neighbor (NN) interpolation tool selects nearby input samples, assigns weights based on their respective areas, and uses this data to interpolate values at query points. Inverse distance weighted (IDW) interpolation assumes closer points are more similar. It predicts values at unmeasured locations based on nearby measured values, weighting closer points more heavily.
Footnotes
1 How Natural Neighbor works. Environmental Systems Research Institute (ESRI) (2024). https://pro.arcgis.com/en/pro-app/latest/tool-reference/spatial-analyst/how-natural-neighbor-works.htm
2 How inverse distance weighted interpolation works. Environmental Systems Research Institute (ESRI) (2024). https://pro.arcgis.com/en/pro-app/latest/help/analysis/geostatistical-analyst/how-inverse-distance-weighted-interpolation-works.htm
Calculating model ages
To ensure readily comparable results with the existing Australia-wide isotopic compilation, two-stage model ages were calculated using the depleted mantle isotopic values of 143Nd/144Nd = 0.513150 and 147Sm/144Nd = 0.2145, and an assumed 147Sm/144Nd value for each sample of 0.1100 for all T older than the magmatic age. In some instances, the magmatic ages (T) assigned in the original data sources have been updated based on new geochronology or revised stratigraphic assignments. In the event no geochronology was available, samples have been assigned inferred magmatic ages based on the understanding of the geology of the region.
Two-stage model ages were calculated using the following equation:
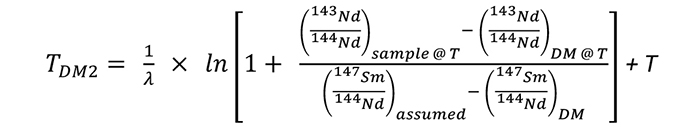
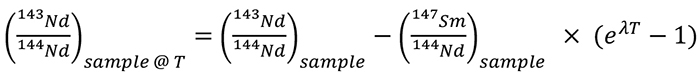
Where λ is the decay constant of Sm (6.54 × 10⁻¹² year-1), T is magmatic crystallisation age and the sample composition at time T is determined using:
TCR were calculated by TDM2 – T, where T is magmatic crystallisation age.
Discussion
Advances since 2013 compilation
The increase in data points since the 2013 map compilation by Champion provides a more detailed and more representative map for South Australia. Refinement in the presence of older crustal material in the interior of South Australia are apparent with the new dataset (e.g. central Gawler Craton and southern Gawler Craton, including Eyre and Yorke Peninsulas; Figure 1 and Figure 2). These likely represent the Archean components of the Gawler Craton and Curnamona Province, and suggest these components are continuous beneath the cratons and are larger in volume than previously interpreted. Figures 1 and 2 also highlight a region of 2400–2700 Ma model ages that correlate with the eastern and northern boundaries/portions of the Gawler Craton. While Gawler Craton is defined as an older (>2400 Ma) crustal element, boundaries of the Curnamona Province are less clearly defined, while the Musgrave Province and the basement to the Murray Basin are defined as juvenile crustal elements. At the broadest scale, these differences in model ages reflect the formation age and tectonic stability of the geological elements of South Australia.
Addition of mafic and intermediate Sm-Nd maps
The 2024 addition of isotopic maps includes TDM2 and TCR maps for mafic to intermediate rocks in South Australia. These additions allow mapping of mantle composition where Sm-Nd isotopes can be used to identify distinct source regions for magmatic rocks and recognise mixing and contamination between isotopically distinct source regions. For mafic to intermediate igneous rocks this may include identifying enriched or depleted mantle sources, and the interaction of these mantle sources with continental crust. These compositional variations may have implications for mineralisation (e.g. IOCG provinces have a connection with metasomatised, ancient subcontinental lithospheric mantle (e.g. Groves et al. 2010), whereas Ni provinces can be associated with asthenospheric mantle-derived magmas, crustal contamination, sulphur saturation and chalcophile element segregation (e.g. Luolavirta et al. 2018)).
Model age maps
Model ages for granites may estimate the age of their source. For mantle-derived granites the model age approximates the time of mantle fractionation of the basaltic precursor to the granite. This is assumed to be very close to the crystallisation age of the granite. Crustal-derived granites will give model ages indicative to the age of their crustal source, which may be old or young depending on their petrogenesis. Model ages for mafic rocks approximate the time of mantle fractionation of their mantle precursor. Where substantial amounts of crustal assimilation have occurred, the model ages may be (significantly) older than their mantle source. Therefore, model ages may indicate the presence of old crust in a region and its incorporation into the melts from which the igneous rocks are derived.
Model age gradients are typically associated with major crustal structures and are potentially important for localising mineral systems (e.g. Lu at el. 2021). The distribution of model ages are shown with respect to major mines and projects in the State (Figs 1 and 2). Broadly, the same crustal elements are identified on these maps for felsic rocks (Figs 1 and 2), the main difference being the smoothing/extrapolation of the gradients.
Model age maps for felsic rocks define the boundaries of the Gawler Craton relatively well. The distribution of Archean ‘cores’ in the central and southern Gawler Craton are prominent features, bound by a region of 2400–2700 Ma crust which broadly coincides with the craton boundaries (Fig. 1A, C). The Archean crust in southern Gawler Craton is shown to be a prevalent feature across Eyre Peninsula and central Gawler Craton. The inner or SW portion of the Gawler Craton is characterised by younger model ages around 1900 to 2200 Ma. Distribution of the 2400–2700 Ma crust in the eastern Gawler Craton broadly aligns with the IOCG province.
The other Proterozoic geological provinces (Musgraves, Curnamona and Coompana provinces) are less well defined in the isotopic gradients for felsic rocks. The Curnamona Province preserves evidence for Archean crust in its eastern most portion, whereas the Musgrave and Coompana provinces contain distributions of younger model ages, highlighting the juvenile nature of these provinces in both mafic and felsic rocks. The Delamerian Orogen is also a prominent feature with young model ages for both felsic (1100–2000 Ma) and mafic rocks (700–1600 Ma).
The majority of mafic to intermediate rocks have model ages between 2200 to 2800 Ma and preserve older model ages in central-northern Gawler Craton and southern Gawler Craton, similar to the felsic rocks (Fig. 2A, C). Older mantle reservoirs coincide where Archean to Palaeoproterozoic basement rocks of the Mulgathing and Sleaford complexes occur in central-NW Gawler Craton and southern Gawler Craton, respectively. A prominent gap is seen in the isotopic data in the central eastern Gawler Craton for mafic to intermediate rocks for model ages 2200–2400 Ma (Fig. 2A, C) which is not observed in the felsic data (Fig. 1A, C). This region aligns with the IOCG province of the Gawler Craton and presumably this isotopic gradient extends across this gap and exists due to sampling bias between Roopena and Olympic Dam in the Stuart Shelf. This older mantle is disrupted by the Neoproterozoic Gairdner Dolerite on the eastern Gawler Craton.
A poorly constrained region of old mantle between the Gawler Craton and Curnamona Province is hinted at by the gridded data (Fig. 3A, C). This region though, suffers from a lack of available samples and constraining data. Deep crustal reflection seismic data indicates the continuation of a similar Archean-Palaeoproterozoic crustal column in between the Gawler Craton and Curnamona Province (beneath the Adelaide Superbasin), supporting the connection indicated by Figure 3 (Korsch and Kositcin (eds) 2010).
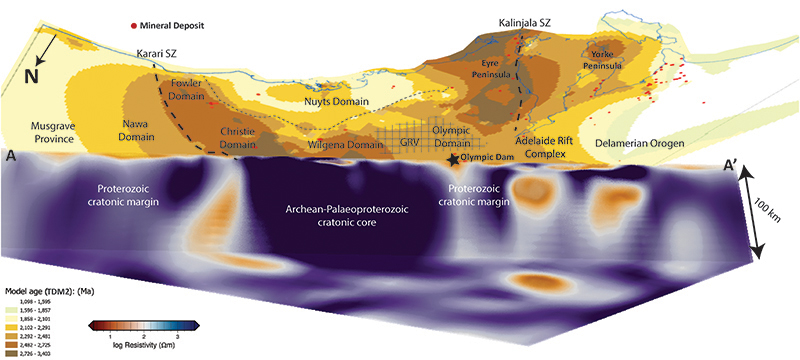
Figure 3 Perspective view through a 3D resistivity model (Thiel and Brand 2023) sliced along profile A-A’ (Fig. 1) beneath a TDM2 grid (Fig. 1C) at the surface, showing the common lithospheric architecture imaged by magnetotellurics and isotopic model ages. Hashed area is a key data gap. View from beneath, looking up to the NNE. Red dots indicate the location of major mines and projects. (PDF 3.5 MB)
Gairdner Dolerite (central Gawler Craton), mafic dykes in Musgrave Province, and mafic rocks in the Delamerian and Mt Painter regions pop up as prominent new/younger mantle occurrences. These are related to relatively young magmatic events (830–390 Ma) recorded in South Australia.
Crustal residence time maps
Crustal residence times represent the length of time the source of the igneous rocks has resided in the crust. In some cases, this may reflect the age of crust formation but often reflects an average crustal residence time of all components in the rock. Crustal residence time maps are shown on Figure 1B and 1D for felsic rocks and Figure 2B and 2D for mafic to intermediate rocks.
Crustal residence times for felsic rocks have a broad range of values (<0 to 1700 Ma), where older TCR are distributed in the outer regions of the Gawler Craton, extending eastward to the Curnamona Province and Delamerian (Fig. 1B, D). The central Gawler Craton, including the SW Gawler Craton, is dominated by younger TCR. These are represented by Archean to Early Palaeoproterozoic felsic rocks of the Cooyerdoo Granite and Mulgathing and Sleaford complexes in the central Gawler Craton and southern Eyre Peninsula, and Mesoproterozoic St Peter Suite and Hiltaba Suite in the SW Gawler Craton (Fig. 1B, D). Younger TCR are also prominent in felsic rocks from the Musgrave Province.
TCR within Mesoproterozoic felsic rocks display a wide range of ages, from ~200 to ~1500 Ma, and these appear to be spatially distributed. For example, St Peter Suite and Hiltaba Suite in Nuyts Domain (SW Gawler Craton) have young crustal residence times (up to 700 Ma) relative to Hiltaba Suite granites and Gawler Range Volcanics (GRV) from central and eastern Gawler Craton which have TCR up to 950 Ma. Moreover, TCR maps also highlight St Peter Suite as having much shorter crustal residence times, 350–700 Ma, compared to the Hiltaba Suite and GRV. This supports old crustal sources associated with the Hiltaba-GRV magmatism, whereas St Peter Suite magmatic rocks are derived from younger crustal sources, and potentially not crustal sources from the ancient Gawler Craton.
Broadly high (long) values show where crust has seen a protracted period of relative stability, then been hit by a younger event. This seems to be concentrated around the margins of the Gawler Craton. This is particularly apparent where TCR maps highlight areas when younger felsic rocks have old TCR (e.g. Mt Painter, Delamerian Coompana and Kangaroo Island), which suggests an older (cratonic margin?) source region for these units.
TCR maps for mafic to intermediate rocks highlight different features to the felsic TCR maps, namely old TCR (up to 1600 Ma) in the Coompana Province, Nawa Domain (e.g. drillhole GOMA 4), some samples in central Gawler Craton and eastern Eyre Peninsula and samples from SE South Australia. Mafic rocks with short crustal residence times are found across stratigraphic units ranging from Archean to Devonian in age. These include c. 3150 Ma amphibolites associated with Cooyerdoo Granite, 2560 Ma Devils Playground Volcanics, 2520 Ma Lake Haris Komatiite, 2440 Ma Sleaford Complex on western Eyre Peninsula, 1680 Ma Lady Louise Suite (Curnamona Province), parts of the c. 1630–1610 Ma St Peter Suite, c. 830 Ma Amata Dolerite/Gairdner Dolerite, ca. 500 Ma Delamerian mafic rocks and c. 390 Ma Ooloo Hill Formation. Short crustal residence times for mafic to intermediate units described above fall into two categories. Either these magmas saw limited older crust/lithospheric mantle during the melt generation/ascent processes due to their emplacement age being close to the model age of the lithospheric column (e.g. Archean mafic rocks), or because of a strong structural control on crustal ascent (e.g. Ooloo Hill Formation; Wade et al. 2023).
Limitations with the data
There are limitations with displaying this isotopic data as gridded data. An initial limitation is the data points for map interpolation are not evenly located. As this type of sampling requires physical hand specimens, there are limitations with accessible material in both outcrop and drill core. There is also inherent sampling bias, particularly in outcrop samples, where more resistive lithologies are likely to be sampled (e.g. leucocratic or feldspathic rocks), and less resistive rocks (e.g. mafic rocks) are underrepresented. An additional limitation with this data is the aspect of the third dimension in drill core. Two limitations arise here, where 2D surfaces are created from samples from drill core, and where multiple samples are collected from the same drill hole, which may represent the same or different stratigraphic units. Access to suitable material and sampling bias has created obvious gaps in the data set. Future sampling and mapping programs of the GSSA will help address some of these data gaps.
Absence of igneous rocks (or absence of collected and analysed samples) in areas such as the Adelaide Superbasin represent a significant gap in the dataset. While this may be an obvious gap in the geological record, other regions are less well represented due to sparsity of outcrop or thick cover sequences (e.g. Stuart Shelf, northern and western Gawler Craton, Murray Basin, Curnamona Province).
A significant, and perhaps easily resolvable, gap exists in the central-eastern Gawler Range Volcanics Province, which occupies a region that links the northern and southern Olympic Cu-Au provinces. The lithological homogeneity of the Upper GRV in the central-eastern Gawler Craton has led to a lack of analyses. A continuum between these two regions is suggested by the Palaeo-Mesoproterozoic geology, and geophysics (Fig. 3), and partly inferred by the isotopic data. This sample gap represents the transition between the eastern and central Gawler Craton, where a gradient between model ages >2700 Ma to the west and ~2400 Ma to the east is expected, representing a palaeo-cratonic margin now host to the Olympic Cu-Au Province (Reid 2019). Utilising Sm-Nd isotopes and model age mapping to delineate this gradient in the mantle in the N-S direction requires additional samples to fill these gaps and may have implications for locating IOCG mineralisation.
Additional sample collection in the Curnamona Province will improve the maps for this region. Benagerie Volcanic Suite samples for example are readily accessible from drill core in the central-northern Curnamona Province. Assessment of suitable samples from southern central Curnamona Province cold be undertaken to find additional igneous material to better resolve the distribution of Archean source material in the eastern Curnamona Province. Better resolution and refinement of isotopic gradients in the Curnamona Province may help provide links with the Gawler Craton, and IOCG mineralisation in the Curnamona Province.
Correlation of isotopic domains and mineral deposits/provinces
South Australia hosts regions with different mineral prospectivity. In the Gawler Craton for example, IOCG deposits are located in the eastern Gawler Craton, while the central Gawler Craton is host to Au deposits and Ni-Cu-platinum group elements (PGE) prospects. The correlation between areas of mineralisation and crustal architecture defined by isotopic mapping has been demonstrated for Western Australia (e.g. Cassidy et al. 2005; Huston et al. 2005, 2014; Mole et al. 2013), and more recently in South Australia (Curtis and Thiel 2019; Skirrow et al. 2018).
At the most fundamental scale, lithospheric architecture can be mapped using a wide variety of techniques (e.g. Curtis and Thiel 2019). Gradients in these datasets signify where litho-chemical or physical property changes occur. Exploration of gradients across scales as mappable criteria used in mineral systems targeting is increasing in its utilisation and has seen recent efforts to show statistical correlations (e.g. Kirkby et al. 2022; Hoggard et al. 2020). Applying a maximum gradient filter to the TDM2 map (Fig. 1C) shows where there are changes in crustal isotopic domains (Fig. 4).
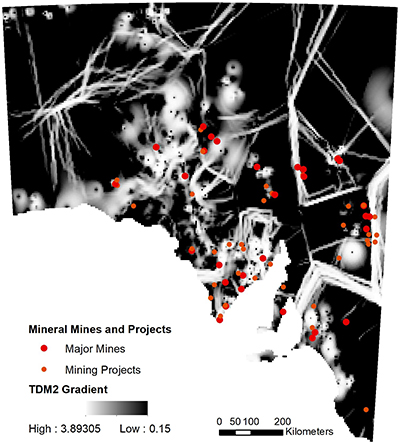
Figure 4 Maximum gradient map of TDM2 isotopic map for felsic rocks (Fig. 1C), shown with major mines and mining projects. Broadly, a correlation exists between mineral deposits and maximum gradients in TDM2 values. (PDF 3.1 MB)
Overlaying the location of major mineral deposits (Mines and Projects) shows a high degree of spatial coincidence between deposits and isotopic gradients. Whilst the gradient map (Fig. 4) is heavily influenced by sample location and the interpolation process, there is obvious encouragement for regional isotopic mapping as an empirical indicator for the possible presence of mineral systems.
In addition to mapping crustal architecture, Sm-Nd isotopes can be used to identify distinct source regions for magmatic rocks and recognise mixing and contamination between these distinct source regions. Thus Sm-Nd isotopes can be used to constrain models of evolution of source regions for magmatic rocks. In mineral systems, identifying distinct source regions can have implications for mineral prospectivity (Wade et al. 2019; Wade et al. 2022). As previously mentioned, Archean-Palaeoproterozoic metasomatised SCLM is associated with IOCG deposits (e.g. Skirrow et al. 2018).
Isotopic maps for South Australia show a region of 2400–2700 and 2200–2400 Ma model ages for felsic and mafic rocks respectively in the Gawler Craton. This region overlaps with the IOCG province in the eastern Gawler Craton, supporting the interpretations of Skirrow et al. (2018) and Groves et al. (2010), that IOCG deposits are associated with ancient, metasomatised SCLM.
The new isotopic maps suggest gold deposits in the central Gawler Craton are associated with older model ages (e.g. Challenger sits near a gradient of 2700–3000 and 3000–3500 Ma model ages and Golf Bore within 3000–3500 Ma model ages). This suggests Archean crust is preserved in the central Gawler Craton and may represent an ancient cratonic margin or core. Re-activation of proto-cratonic margins along major shear zones in this area (central-western Gawler Craton) have recently been suggested to control and/or remobilise gold and nickel mineralisation (Pawley et al. 2024).
Conclusions
Increased Sm-Nd datasets for igneous rocks in South Australia has refined the model age and crustal residence time maps, revealing higher resolution of crustal and mantle domains across the State. Of significance are well defined source regions in the Gawler Caton, including several Archean source regions now apparent in the central Gawler Craton and better definition of the Nuyts Domain.
Substantial portions of the Curnamona Province are absent of isotopic data due to deep cover in the western and eastern Curnamona Province, and absence of igneous rocks or sampled igneous rocks in the central Curnamona Province.
Interesting patterns in crustal and mantle reservoirs are revealed with the new isotopic maps for South Australia. The best resolution in crustal elements is clear in the Gawler Craton, where data density and distribution are the greatest. New links with these domains and mineralisation are also emerging, particularly where isotopic gradients are identified (Fig. 4).
While coverage for the State is still relatively sparse, these maps highlight some interesting relationships between mineral provinces and isotopic gradients, as well as proving areas to follow up with isotopic analysis for future programs.
Acknowledgements
David Bruce and Rob Klaebe, University of Adelaide, are thanked for collecting Nd data for the Geological Survey of South Australia. Jarred Lloyd is thanked for assistance with co-ordinate transformations and Wolfgang Preiss is thanked for providing estimated locations for samples in the Adelaide Superbasin. Jess Bonsell, Geological Survey of South Australia, is gratefully acknowledged for drafting Figures 1 and 2. We appreciate constructive comments and useful suggestions by Dillon Brown and Jack Percival, Geological Survey of South Australia.
Data product and appendicies
The 2024 Sm-Nd data compilation is available as a Geoscientific Data Package (GDP) which includes rasters, spatial layers and point data available at https://pid.sarig.sa.gov.au/dataset/mesac195. While sedimentary, metasedimentary, S-type granites and non-representative samples (e.g. metasomatic rocks, xenoliths, enclaves, or mineral analyses) were not included in the gridding, these data are available in the accompanying dataset for SA. Grids were generated using peripheral data in geological provinces that extend beyond the State border (e.g. Murray Basin in VIC, Curnamona Province in NSW, Musgrave Province in NT and WA, Coompana Province in WA). These data are not included in the accompanying dataset but can be accessed in Champion (2013).
References
Cassidy KF, Champion DC and Huston DL 2005. Crustal evolution constraints on the metallogeny of the Yilgarn Craton. In J Mao and FP Bierlein (eds). Mineral Deposit Research: Meeting the Global Challenge. Spring, Berlin/Heidelberg, pp. 901–904.
Champion DC and Cassidy KF 2007. An overview of the Yilgarn Craton and its crustal evolution. In FP Bierlein and CM Knox-Robinson (eds). Proceedings of Geoconferences (WA) Inc. Kalgoorlie ’07 Conference, 25-27 September 2007, Kalgoorlie, Western Australia. Geoscience Australia Record 2007/14:8–13.
Champion DC 2013. Neodymium depleted mantle model age map of Australia: explanatory notes and user guide. Record 2013/44. Geoscience Australia: Canberra. http://dx.doi.org/10.11636/Record.2013.044
Curtis S and Thiel S 2019. Identifying lithospheric boundaries using magnetotellurics and Nd isotope geochemistry: an example from the Gawler Craton, Australia. Precambrian Research 320:403–423. https://doi.org/10.1016/j.precamres.2018.11.013
Griffin WL, Begg GC and O’Reilly SY 2013. Continental-root control on the genesis of magmatic ore deposits. Nature Geoscience 6(11):905–910. https://doi.org/10.1038/ngeo1954
Groves DI, Bierlein FP, Meinert LD and Hitzman MW 2010. Iron Oxide Copper-Gold (IOCG) Deposits through Earth History: Implications for Origin, Lithospheric Setting, and Distinction from Other Epigenetic Iron Oxide Deposits. Economic Geology 105(3):641–654. https://doi.org/10.2113/gsecongeo.105.3.641
Hoggard MJ, Czarnota K, Richards FD, Huston DL, Jaques AL and Ghelichkhan S 2020. Global distribution of sediment-hosted metals controlled by craton edge stability. Nature Geoscience 13(7):504–510. https://doi.org/10.1038/s41561-020-0593-2
Huston DL, Champion DC and Cassidy KF 2005. Tectonic controls on the endowment of Archean cratons in VHMS deposits: evidence from Pb and Nd isotopes. In J Mao and FP Bierlein (eds). Mineral Deposit Research: Meeting the Global Challenge. Springer, Berlin/Heidelberg, pp. 15–18.
Huston DL, Champion DC and Cassidy KF 2014. Tectonic controls on the endowment of Neoarchean cratons in volcanic-hosted massive sulfide deposits: Evidence from lead and neodymium isotopes. Economic Geology 109 (1):11–26. http://doi.org/10.2113/econgeo.109.1.11
Kirkby A, Czarnota K, Huston DC, Champion MP, Doublier PA, Bedrosian JD and Heinson G 2022. Lithospheric conductors reveal source regions of convergent margin mineral systems. Scientific Reports 12, 8190 (2022). https://doi.org/10.1038/s41598-022-11921-2
Korsch RJ and Kositcin N (eds) 2010. South Australian Seismic and MT Workshop 2010. Geoscience Australia, Record, 2010/10.
Luolavirta K, Hanski E, Maier W, Lahaye Y, O’Brien H and Santaguida F 2018. In situ strontium and sulfur isotope investigation of the Ni-Cu-(PGE) sulfide ore-bearing Kevitsa intrusion, northern Finland. Mineralium Deposita 53:1019–1038. https://doi:10.1007/s00126-018-0792-6
Lu Y, Wingate MTD, Champion DC, Smithies RH, Johnson SP, Mole DR, Poujol M, Zhao J, Maas R and Creaser RA 2021. Samarium–neodymium isotope map of Western Australia: Geological Survey of Western Australia, digital data layer. https://www.dmirs.wa.gov.au/geoview
Mole DR, Fiorentini ML, Cassidy KF, Kirkland CL, Thebaud N, McCuaig TC, Doublier MP, Duuring P, Romano SS, Maas R, Belousova EA, Barnes SJ and Miller J 2015. Crustal evolution, intra-cratonic architecture and the metallogeny of an Archaean craton. Geological Society, London, Special Publications 393(1):23–80. https://doi.org/10.1144/SP393.8
Pawley M, Wade C, Petts A, Thiel S and Krapf C 2024. Western Gawler and Gawler Phase 2 Geoscience Insights Workshop extended abstracts. Department for Energy and Mining, South Australia, Adelaide. https://pid.sarig.sa.gov.au/document/2024d056066
Reid A 2019. The Olympic Cu-Au Province, Gawler Craton: A Review of the Lithospheric Architecture, Geodynamic Setting, Alteration Systems, Cover Successions and Prospectivity. Minerals 2019, 9, 371. https://doi.org/10.3390/min9060371
Skirrow R, van der Wielen SE, Champion DC, Czarnota K and Thiel S 2018. Lithospheric architecture and mantle metasomatism linked to iron-oxide Cu-Au ore formation: Multidisciplinary evidence from the Olympic Dam region, South Australia. Geochemistry, Geophysics, Geosystems 19. https://doi.org/https://doi.org/10.1029/2018GC007561
Tassara S, González-Jiménez JM, Reich M, Schilling ME, Morata D, Begg G, Saunders E, Griffin WL, O’Reilly SY, Grégoire M, Barra F and Corgne A 2017. Plume-subduction interaction forms large auriferous provinces. Nature Communications 8(1):843. https://doi.org/10.1038/s41467-017-00821-z
Thiel S and Brand K 2023. Gawler AusLAMP resistivity model. Geoscientific Data Package 90 (GDP00090). Department for Energy and Mining, South Australia. https://pid.sarig.sa.gov.au/dataset/mesac195
Wade C, Reid AJ, Jagodzinski EA and Sheard MJ 2022. Mid-Devonian basaltic magmatism and associated sedimentation: the Ooloo Hill Formation, central-eastern South Australia. Australian Journal of Earth Sciences 70(1):91–112. https://doi.org/10.1080/08120099.2022.2116108